
Note, before being able to use the queries discussed below, you will need to set-up an AWS Athena database, table and partitions. For this, please refer to our Creating a Database, Table and Partitions in Athena page. Additionally, for an overview of the terms used below, please refer to the data dictionary provided.
The DAU/MAU ratio provides a high-level look at how many days in a given month devices are seen in the dataset. It other words, it provides an indication of the frequency with which a user is being identified or seen within the dataset.
The DAU/MAU Ratio is bounded from 0 to 100%. A ratio closer to 100% suggests that the devices in the dataset are seen more days in the month, and therefore shows a good level of engagement with most users being seen daily.
This simple ratio, is derived by dividing DAU by MAU to get the ratio percentage:

For example: If you have 1,000,000 daily users and 2,000,000 monthly users, the DAU/MAU ratio is 50%.
Depending on the use case, different DAU/MAU will be required from a dataset. For example, if an advertiser is building customer audiences, it may be sufficient to have a low DAU/MAU ratio as they are simply looking for devices seen within specific locations, e.g. all devices seen within 1 KM of Central Park in New York. Conversely, an analytics and research company looking to understand consumer behaviours will want a high DAU/MAU ratio as they are trying to identify patterns in behaviours, e.g. in the morning, people living East of Manila Bay travel West for work, of those, 60% travel North at lunch time, and 40% travel South in the evening. Therefore, the more granularity a use case requires within a single day, the higher the DAU/MAU ration should be.
In the context of location data, an event is defined as a single data point from one device containing location data attributes, such as, latitude, longitude, timestamp, horizontal accuracy, etc. Check out our data dictionary for a full list of attributes available.
A useful metric often used for evaluation is events per device. This metric shows how many events are logged per device in a given period of time (day, week, month etc.). Most often events per device per day are used to gauge the density of the data within 1 given day. Most companies and organization use this metric as a measure of depth, as more events per device provide more information on the users movements and habits.
BE CAREFUL. While this metric is a good starting point into the depth of the data, it is recommended not to rely solely on this metric.
Consider this, you may be drawn to conclude that a device emitting over 200 events per day will provide a lot of information about the user of that device. However, if that device is emitting this information from a single location, then the value of all this information is significantly reduced. This is because location data has an added dimensions of time and space (also known as a spatiotemporal), which is not captured in this metric.
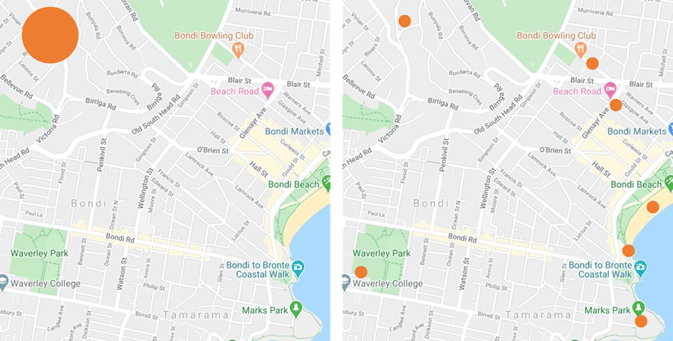 The map on the LHS shows 200 events points in location. The map on the RHS shows 7 events distributed spatially.
It is also useful to look at events per device per day in time series.
Due to different types of data sources, user habits, SDK and device-specific settings, the distribution of events per device per day may be irregular over time. For example, it is possible that events could be highly concentrated within a short window. The following chart illustrates this point visually.
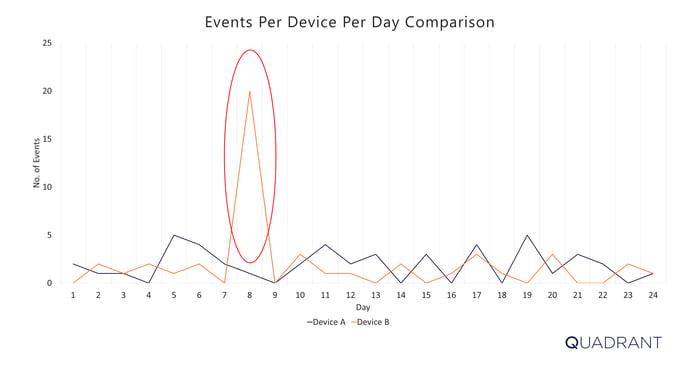
Events Per Device Per Day in times series of 2 devices (in orange and blue)
Below, we present the codes to extract the Average Events Per Device Per Day :
/* AVERAGE EVENTS PER DEVICE PER DAY */
SELECT AVG(avg_evnts_per_dev) as avg_evnts_per_device_per_day
FROM
    (SELECT device_id,
            avg(event_cnt) as avg_evnts_per_dev
    FROM
            (SELECT lower(device_id) AS device_id,
                count(*) AS event_cnt,
                day
            FROM
                (SELECT device_id,
                        day
                FROM [your_database.your_table]
                WHERE (month = 3 AND year = 2020) )
            GROUP BY  1, 3)
    GROUP BY 1)
GROUP BY 1;
Below, we present the codes to extract the Average Events Per Device Per Day by Bracket (0 - 10 events, 10 - 50 events, 100 - 500 events, 500 - 2,500 events, and over 2,500 events):
/* AVERAGE EVENTS PER DEVICE PER DAY BY BRACKETS */
SELECT kv['0 - 10'] AS lt_10, kv['10 - 50'] AS betw_10_50, kv['50 - 100'] AS betw_50_100, kv['100 - 500'] AS betw_100_500, kv['500 - 2.5k'] AS betw_500_2500, kv['over 2.5k'] AS gt_2500
FROM
      (SELECT map_agg(EventRange, cnt) kv
      FROM
            (SELECT EventRange,
                    cnt
            FROM
                  (SELECT CASE WHEN avg_evnts_per_day >= 0 AND avg_evnts_per_day <= 10 THEN '0 - 10'
                              WHEN avg_evnts_per_day > 10 AND avg_evnts_per_day <= 50 THEN '10 - 50'
                              WHEN avg_evnts_per_day > 50 AND avg_evnts_per_day <= 100 THEN '50 - 100'
                              WHEN avg_evnts_per_day > 100 AND avg_evnts_per_day <= 500 THEN '100 - 500'
                              WHEN avg_evnts_per_day > 500 AND avg_evnts_per_day <= 2500 THEN '500 - 2.5k' ELSE 'over 2.5k'
                              END EventRange, count(device_id) AS cnt
                  FROM
                        (SELECT device_id,
                              avg(event_cnt) as avg_evnts_per_day
                        FROM
                              (SELECT lower(device_id) AS device_id,
                                    count(*) AS event_cnt,
                                    day
                              FROM
                                    (SELECT device_id,
                                          day
                                    FROM [your_database.your_table]
                                    WHERE (month = 3 AND year = 2020) )
                              GROUP BY  1, 3)
                        GROUP BY 1)
                  GROUP BY 1)
            )
      );
Two metrics additional metrics of interest are, Days Seen Per Month and Hours Seen Per Day, which provide a temporal element to the distribution of events.
Days seen per month is defined as the number of devices seen X number of distinct days per month.
Hours seen per day is defined as the number of devices seen X number of distinct hours per day.
As is the case with events per day, these 2 metrics have their limitations, in that they not distinguishing the number of events seen per day, e.g. having 100 events seen or 3 events seen in a day would both count as 1 distinct day seen per month under this metric.
Below, we present the codes to extract the Average Days Seen Per Month:
/* AVERAGE DAYS SEEN PER MONTH */
SELECT AVG(dayCount) as average_days_seen_per_month
FROM
    (SELECT device_id,
            count(distinct day(from_unixtime(timestamp/1000))) AS dayCount
    FROM
            (SELECT lower(device_id) AS device_id,
                timestamp
            FROM [your_database.your_table]
            WHERE (month = 2 AND year = 2020) )
    WHERE month(from_unixtime(timestamp/1000)) = 2 AND year(from_unixtime(timestamp/1000)) = 2020
    GROUP BY 1)
GROUP BY 1
Below, we present the codes to extract the Average Days Seen Per Month by Brackets (February 1 - 29):
Note, for months with 30 and 31 days, additional brackets (denoted by 'kv') will be required.
/* AVERAGE DAYS SEEN PER MONTH BY BRACKETS */
SELECT kv['1'] AS no_of_devices_seen_for_1_day,kv['2'] AS no_of_devices_seen_for_2_days, ... ,kv['29'] AS no_of_devices_seen_for_29_days
FROM
      (SELECT map_agg(daycount,num_user) kv
      FROM
            (SELECT cast(dayCount AS varchar(8)) AS daycount,
                    num_user
            FROM
                  (SELECT dayCount,
                        count(device_id) AS num_user
                  FROM
                        (SELECT device_id,
                              count(distinct day(from_unixtime(timestamp/1000))) AS dayCount
                        FROM
                              (SELECT lower(device_id) AS device_id,
                                    timestamp
                              FROM [your_database.your_table]
                              WHERE (month = 2 AND year = 2020) )
                        WHERE month(from_unixtime(timestamp/1000)) = 2 AND year(from_unixtime(timestamp/1000)) = 2020
                        GROUP BY 1)
                  GROUP BY 1)
            )
      )
Below, we present the codes to extract the Average Hours Seen Per Day:
/* AVERAGE HOURS SEEN PER DAY */
SELECT AVG(hour_seen) as average_hours_seen_per_device
FROM
    (SELECT day(from_unixtime(timestamp/1000)) AS day,
        approx_distinct(hour(from_unixtime(timestamp/1000))) AS hour_seen,
        device_id
    FROM
        (SELECT lower(device_id) AS device_id,
                timestamp
        FROM [your_database.your_table]
        WHERE (month = 2 AND year = 2020) )
    GROUP BY 1, 3)
GROUP BY 1);
Below, we present the codes to extract the Average Hours Seen Per Day by Brackets (1 - 24 hours):
/* AVERAGE HOURS SEEN PER DAY BY BRACKETS */
SELECT kv['1'] AS no_of_devices_seen_for_1_hr,kv['2'] AS hr_seen_2 AS no_of_devices_seen_for_2_hrs, ..., kv['24']AS no_of_devices_seen_for_24_hrs
FROM
      (SELECT map_agg(avg_hr_seen_per_day,no_of_devices) kv
      FROM
            (SELECT CAST(avg_hr_seen_per_day AS VARCHAR(8)) AS avg_hr_seen_per_day,
                    no_of_devices
            FROM
                  (SELECT avg_hr_seen_per_day,
                        count(device_id) AS no_of_devices
                  FROM
                        (SELECT device_id,
                            ROUND(avg(hour_seen)) as avg_hr_seen_per_day
                        FROM
                              (SELECT day(from_unixtime(timestamp/1000)) AS day,
                                    approx_distinct(hour(from_unixtime(timestamp/1000))) AS hour_seen,
                                    device_id
                              FROM
                                    (SELECT lower(device_id) AS device_id,
                                          timestamp
                                    FROM [your_database.your_table]
                                    WHERE (month = 2 AND year = 2020) )
                              GROUP BY 1, 3)
                        GROUP BY 1)
                  GROUP BY 1)
            )
      );
We hope the the information on this page equips you with the right tools to conduct a thorough data evaluation. If you are looking for a reliable location data feed, Quadrant has GPS location data derived from location SDKs.