
Note, before being able to use the queries discussed below, you will need to set up an AWS Athena database, table and partitions. For this, please refer to our Creating a Database, Table and Partitions in Athena page. Additionally, for an overview of the terms used below, please refer to the data dictionary provided.
Daily Active Users (DAU) is the calculated total number of unique users seen, or delivered, in one day. This metric is important because it provides a measure of scale or reach within a particular location.
Average Daily Active Users (aDAU) is the calculated number of the average DAU delivered in a calendar month. aDAU is calculated as the total number of unique Users delivered each day, divided by the total days in the month (or partial month).
For example, aDAU = (SUM: total unique Users received each day) / (Applicable days in a month)
Since DAU is a volatile metric, due to variations in-app usage on a daily basis, the aDAU is most often used as the key evaluation metric for scale because it tends to be more stable over time. The graph below demonstrates daily fluctuations in DAU varying from 1,000,000 to 5,500,000 devices (at first sight appearing unstable), however, the aDAU across the 3-month period stays constant at around 3,000,000 devices.

The aDAU for the month (Orange line) is often taken to provide a better approximation of scale
Below, we present the codes to extract the Average DAU of your data:
/* aDAU */
SELECT avg(DAU) as aDAU FROM ( SELECT day,COUNT(DISTINCT
lower(device_id))) AS DAU FROM [your_database.your_table]
WHERE (month = 2 AND year = 2020) GROUP BY 1)
Monthly Active Users (MAU) is the calculated total number of unique Users delivered in a calendar month.
Similar to the DAU metric, this metric is useful to evaluate the total scale or reach of a dataset within a particular location.
Below, we present the codes to extract the MAU of your data:
/* MAU */
SELECT count(distinct (lower(device_id))) AS MAU
FROM [your_database.your_table]
WHERE (month = 2 AND year = 2020)Apart from calculating a point estimate, aDAU and MAU are also useful when plotted in a time series in order to show trend and seasonality. As most organizations who use location data require data feeds over a period of time, it is important to understand how scale changes over time. In particular, Quadrant is constantly working to improve its coverage globally by adding new data sources which result in an increase in MAU and aDAU counts over time.
For certain organisations, such as market research and financial firms, identifying and accounting for trends and seasonality is very important as it may skew results from their models.
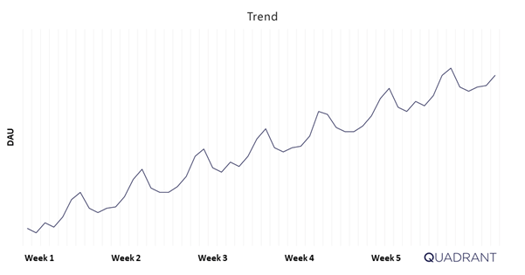
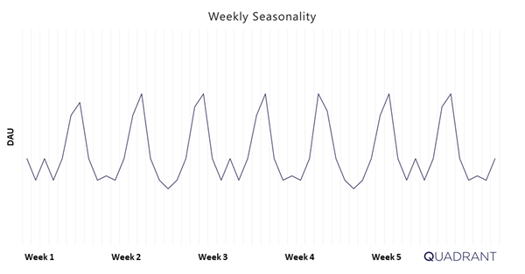
In the charts above, we can see clear sign of uptrend and weekly seasonality in the DAU.
These factors could be identified and accounted for in your models.
The DAU/MAU ratio provides a high-level look at how many days in a given month are devices seen within the dataset. In other words, it provides an indication of the frequency with which a user is being identified or seen within the dataset.
The DAU/MAU ratio is bounded from 0 to 100%. A ratio closer to 100% suggests that the devices in the dataset are seen more days in the month, and therefore show a good level of engagement with most users being seen daily.
This simple ratio is derived by dividing DAU by MAU to get the ratio percentage:

For example: If you have 1,000,000 daily users and 2,000,000 monthly users, the DAU/MAU ratio is 50%.
Depending on the use case, different DAU/MAU will be required from a dataset. For example, if an advertiser is building customer audiences, it may be sufficient to have a low DAU/MAU ratio as they are simply looking for devices seen within specific locations, e.g. all devices seen within 1 KM of Central Park in New York. Conversely, an analytics and research company looking to understand consumer behaviours will want a high DAU/MAU ratio as they are trying to identify patterns in behaviours, e.g. in the morning, people living East of Manila Bay travel West for work, of those, 60% travel North at lunchtime, and 40% travel South in the evening. Therefore, the more granularity a use case requires within a single day, the higher the DAU/MAU ratio should be.
In the context of location data, an event is defined as a single data point from one device containing location data attributes, such as, latitude, longitude, timestamp, horizontal accuracy, etc. Check out our data dictionary for a full list of attributes available.
A useful metric often used for evaluation is events per device. This metric shows how many events are logged per device in a given period of time (day, week, month etc.). Most often events per device per day are used to gauge the density of the data within 1 given day. Most companies and organization use this metric as a measure of depth, as more events per device provide more information on the users movements and habits.
BE CAREFUL. While this metric is a good starting point into the depth of the data, it is recommended not to rely solely on this metric.
Consider this, you may be drawn to conclude that a device emitting over 200 events per day will provide a lot of information about the user of that device. However, if that device is emitting this information from a single location, then the value of all this information is significantly reduced. This is because location data has an added dimensions of time and space (also known as a spatiotemporal), which is not captured in this metric.
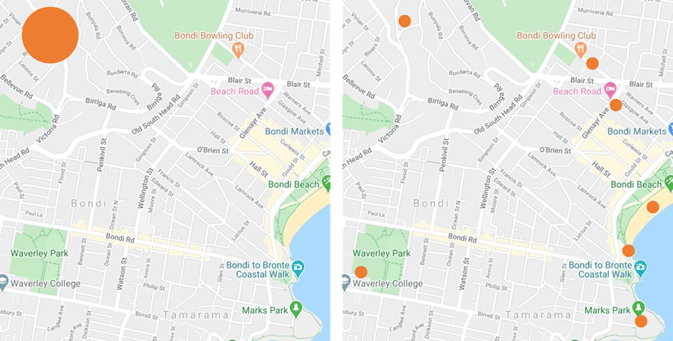 The map on the LHS shows 200 events points in location. The map on the RHS shows 7 events distributed spatially.
It is also useful to look at events per device per day in time series.
Due to different types of data sources, user habits, SDK and device-specific settings, the distribution of events per device per day may be irregular over time. For example, it is possible that events could be highly concentrated within a short window. The following chart illustrates this point visually.
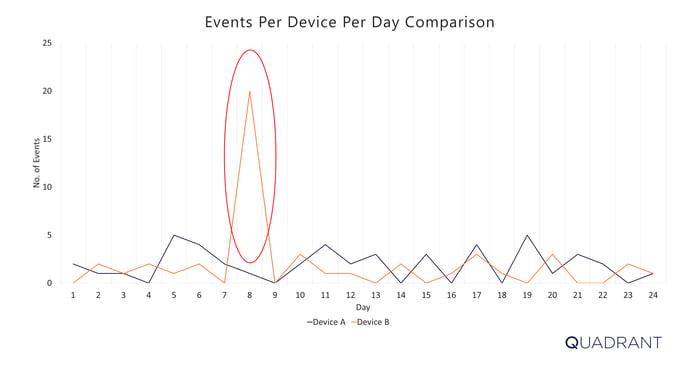
Events Per Device Per Day in times series of 2 devices (in orange and blue)
Below, we present the codes to extract the Average Events Per Device Per Day :
/* AVERAGE EVENTS PER DEVICE PER DAY */
SELECT AVG(avg_evnts_per_dev) as avg_evnts_per_device_per_day
FROM
(SELECT device_id,
avg(event_cnt) as avg_evnts_per_dev
FROM
(SELECT lower(device_id) AS device_id,
count(*) AS event_cnt,
day
FROM
(SELECT device_id,
day
FROM [your_database.your_table]
WHERE (month = 3 AND year = 2020) )
GROUP BY 1, 3)
GROUP BY 1)
GROUP BY 1;
Below, we present the codes to extract the Average Events Per Device Per Day by Bracket (0 - 10 events, 10 - 50 events, 100 - 500 events, 500 - 2,500 events, and over 2,500 events):
/* AVERAGE EVENTS PER DEVICE PER DAY BY BRACKETS */
SELECT kv['0 - 10'] AS lt_10, kv['10 - 50'] AS betw_10_50, kv['50 - 100'] AS betw_50_100, kv['100 - 500'] AS betw_100_500, kv['500 - 2.5k'] AS betw_500_2500, kv['over 2.5k'] AS gt_2500
FROM
      (SELECT map_agg(EventRange, cnt) kv
      FROM
            (SELECT EventRange,
                    cnt
            FROM
                  (SELECT CASE WHEN avg_evnts_per_day >= 0 AND avg_evnts_per_day <= 10 THEN '0 - 10'
                              WHEN avg_evnts_per_day > 10 AND avg_evnts_per_day <= 50 THEN '10 - 50'
                              WHEN avg_evnts_per_day > 50 AND avg_evnts_per_day <= 100 THEN '50 - 100'
                              WHEN avg_evnts_per_day > 100 AND avg_evnts_per_day <= 500 THEN '100 - 500'
                              WHEN avg_evnts_per_day > 500 AND avg_evnts_per_day <= 2500 THEN '500 - 2.5k' ELSE 'over 2.5k'
                              END EventRange, count(device_id) AS cnt
                  FROM
                        (SELECT device_id,
                              avg(event_cnt) as avg_evnts_per_day
                        FROM
                              (SELECT lower(device_id) AS device_id,
                                    count(*) AS event_cnt,
                                    day
                              FROM
                                    (SELECT device_id,
                                          day
                                    FROM [your_database.your_table]
                                    WHERE (month = 3 AND year = 2020) )
                              GROUP BY  1, 3)
                        GROUP BY 1)
                  GROUP BY 1)
            )
);Two metrics additional metrics of interest are, Days Seen Per Month and Hours Seen Per Day, which provide a temporal element to the distribution of events.
Days seen per month is defined as the number of devices seen X number of distinct days per month.
Hours seen per day is defined as the number of devices seen X number of distinct hours per day.
As is the case with events per day, these 2 metrics have their limitations, in that they not distinguishing the number of events seen per day, e.g. having 100 events seen or 3 events seen in a day would both count as 1 distinct day seen per month under this metric.
Below, we present the codes to extract the Average Days Seen Per Month:
/* AVERAGE DAYS SEEN PER MONTH */
SELECT AVG(dayCount) as average_days_seen_per_month
FROM
    (SELECT device_id,
            count(distinct day(from_unixtime(timestamp/1000))) AS dayCount
    FROM
            (SELECT lower(device_id) AS device_id,
                timestamp
            FROM [your_database.your_table]
            WHERE (month = 2 AND year = 2020) )
    WHERE month(from_unixtime(timestamp/1000)) = 2 AND year(from_unixtime(timestamp/1000)) = 2020
    GROUP BY 1)
GROUP BY 1
Below, we present the codes to extract the Average Days Seen Per Month by Brackets (February 1 - 29):
Note, for months with 30 and 31 days, additional brackets (denoted by 'kv') will be required.
/* AVERAGE DAYS SEEN PER MONTH BY BRACKETS */
SELECT kv['1'] AS no_of_devices_seen_for_1_day,kv['2'] AS no_of_devices_seen_for_2_days, ... ,kv['29'] AS no_of_devices_seen_for_29_days
FROM
      (SELECT map_agg(daycount,num_user) kv
      FROM
            (SELECT cast(dayCount AS varchar(8)) AS daycount,
                    num_user
            FROM
                  (SELECT dayCount,
                        count(device_id) AS num_user
                  FROM
                        (SELECT device_id,
                              count(distinct day(from_unixtime(timestamp/1000))) AS dayCount
                        FROM
                              (SELECT lower(device_id) AS device_id,
                                    timestamp
                              FROM [your_database.your_table]
                              WHERE (month = 2 AND year = 2020) )
                        WHERE month(from_unixtime(timestamp/1000)) = 2 AND year(from_unixtime(timestamp/1000)) = 2020
                        GROUP BY 1)
                  GROUP BY 1)
            )
      )
Below, we present the codes to extract the Average Hours Seen Per Day:
/* AVERAGE HOURS SEEN PER DAY */
SELECT AVG(hour_seen) as average_hours_seen_per_device
FROM
    (SELECT day(from_unixtime(timestamp/1000)) AS day,
        approx_distinct(hour(from_unixtime(timestamp/1000))) AS hour_seen,
        device_id
    FROM
        (SELECT lower(device_id) AS device_id,
                timestamp
        FROM [your_database.your_table]
        WHERE (month = 2 AND year = 2020) )
    GROUP BY 1, 3)
GROUP BY 1);
Below, we present the codes to extract the Average Hours Seen Per Day by Brackets (1 - 24 hours):
/* AVERAGE HOURS SEEN PER DAY BY BRACKETS */
SELECT kv['1'] AS no_of_devices_seen_for_1_hr,kv['2'] AS hr_seen_2 AS no_of_devices_seen_for_2_hrs, ..., kv['24']AS no_of_devices_seen_for_24_hrs
FROM
      (SELECT map_agg(avg_hr_seen_per_day,no_of_devices) kv
      FROM
            (SELECT CAST(avg_hr_seen_per_day AS VARCHAR(8)) AS avg_hr_seen_per_day,
                    no_of_devices
            FROM
                  (SELECT avg_hr_seen_per_day,
                        count(device_id) AS no_of_devices
                  FROM
                        (SELECT device_id,
                            ROUND(avg(hour_seen)) as avg_hr_seen_per_day
                        FROM
                              (SELECT day(from_unixtime(timestamp/1000)) AS day,
                                    approx_distinct(hour(from_unixtime(timestamp/1000))) AS hour_seen,
                                    device_id
                              FROM
                                    (SELECT lower(device_id) AS device_id,
                                          timestamp
                                    FROM [your_database.your_table]
                                    WHERE (month = 2 AND year = 2020) )
                              GROUP BY 1, 3)
                        GROUP BY 1)
                  GROUP BY 1)
            )
      );
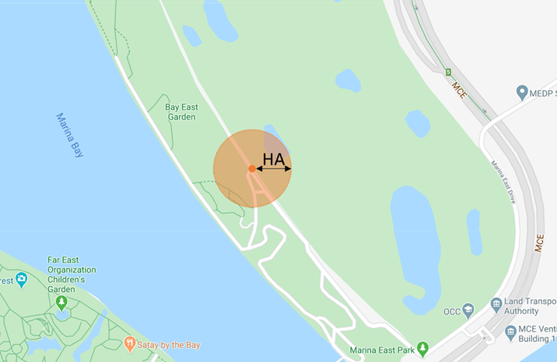
Horizontal accuracy is the measure of GPS accuracy, expressed in meters, as reported by the device's operating system.
Horizontal Accuracy is a radius around a 2-dimensional point, implying that the true location of the data point is somewhere within the circle formed by the given point as a center and the accuracy as a radius. Therefore, in the example below, the exact location of the device will be anywhere within the orange shaded circle.
GPS accuracy of a mobile device is not solely dependent on the GPS sensor itself, there are a lot of factors like network signal, nearby cell towers, nearby Wi-Fi, onboard sensors, inertial navigation from the accelerometer, gyroscope, and compass. All of these factors have an impact on the recorded horizontal accuracy.
It is important to understand horizontal accuracy, as different use cases require different levels of accuracy readings. For example, heatmaps and analysis of mobility at city levels can generally be done accurately with higher levels of horizontal accuracy, while retail analysis on typically small venues such as restaurants and shops requires smaller and more precise levels of horizontal accuracy.
Below, we present the codes to extract the Average Horizontal Accuracy of your data:
/* AVERAGE HORIZONTAL ACCURACY */
SELECT AVG(horizontal_accuracy) as avg_horizontal_accuracy
FROM [your_database.your_table]
WHERE (month = 2 AND year = 2020) AND (try_cast(horizontal_accuracy as varchar)<>'');
Below, we present the codes to extract the Number of Events by Brackets of Average Horizontal Accuracy of your data (0 - 10m, 10 - 20m, 20 - 50m, 50 - 100m, and 100 - 200m):
/* NUMBER OF EVENTS BY BRACKETS ON AVERAGE HORIZONTAL ACCURACY */
SELECT kv['0 - 10'] AS lt_10, kv['10 - 20'] AS betw_10_20, kv['20 - 50'] AS betw_20_50, kv['50 - 100'] AS betw_50_100, kv['100 - 200'] AS betw_100_200
FROM
      (SELECT map_agg(HorRange, cnt) kv
      FROM
            (SELECT HorRange,
                  cnt
            FROM
                  (SELECT case when horizontal_accuracy >= 0 and horizontal_accuracy <= 10 then '0 - 10'
                              when horizontal_accuracy > 10 and horizontal_accuracy <= 20 then '10 - 20'
                              when horizontal_accuracy > 20 and horizontal_accuracy <= 50  then '20 - 50'
                              when horizontal_accuracy > 50 and horizontal_accuracy <= 100  then '50 - 100'
                              when horizontal_accuracy > 100 and horizontal_accuracy <= 500  then '100 - 200'
                              else 'over 5k' end HorRange, count(*) as cnt
                  FROM [your_database.your_table]
                  WHERE (month = 2 AND year = 2020) AND (try_cast(horizontal_accuracy as varchar)<>'')
                  GROUP BY 1)
            )

    );
Our online suite of quality metrics provides you with access to an overview prior to running a full evaluation.
To evaluate sample location data for purchase contact our data consultants