
Lower Volumes and Scale- A location SDK collects the user's real-world location from the apps on the user's phone. This type of location data requires a direct integration of the SDK into individual applications, so the volumes will be significantly lower compared to Bidstream.
High Accuracy - SDKs collect high-precision GPS location data with an indication of the level of accuracy of the signal.
Consent - The SDK provider is required to obtain users' consent to collect non-contextual device location with an explicit opt-in to comply with privacy regulations.
Security and Privacy - The SDK provider is required to encrypt and protect user data from the app to the cloud. They must also inform users about privacy policies and data sharing.
Costlier but Higher Quality than Bidstream data - Location SDK data is available in lower volumes and it is more expensive – but it is much more accurate.
Even though accurate, data providers can manipulate SDK data to make it look voluminous than it is.
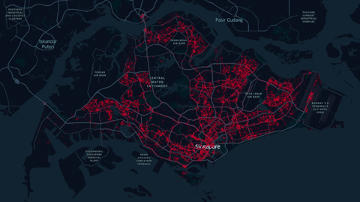 In the image, we see mobile SDK location data in Singapore. The dots are concentrated in areas of high population density and clear movement patterns are observed along the roads.
To assess data quality buyers should look for the following red flags.
Lack of movement: A lack of movement tends to be an indicator of low-quality location data, whereas high-quality data shows lots of movement.
“Kansas farm” (and other similar phenomena): Data that shows a lot of people at the same coordinates beyond what is to be reasonably expected, is always a red flag. (See the famous use case here)
Teleportation: The same device appearing in multiple countries or regions within the same 24-hour period points to extreme inaccuracies in the data.
A software development kit (SDK) is a set of software tools and programs used by developers to create applications for digital platforms – such as iOS, Android, Windows, etc.
If we unpack an SDK, we will find inside resources like libraries, examples of code, processes, and documents. These tools help developers in building their applications.
SDKs also allow app publishers to provide advanced functionality. One important example of this would be to provide location data readings from a user’s mobile device. This is achieved by enabling the in-built GPS which most smartphones have.
There are also SDKs that allow app publishers monetisation options. This is commonly done by showing advertisements in the apps, or by collecting anonymous data. The latter is how Quadrant's location data is derived. Note that this is only done when the user’s consent has been granted to the apps they are using. Learn more about Quadrant's App Monetisation Program here.
DAU/MAU RATIO
One of the baseline metrics we look at when analysing location data for quality is the Daily Active Users (DAU) and Monthly Active Users (MAU) ratio. In a nutshell, this helps us approximate how consistent a panel (group of mobile devices) is over the course of a month. The higher the number, the better.
DATA COMPLETENESS
The amount of data captured is dependent on a number of factors including device hardware, SDK collection methodology, user opt-in permission, etc. As such, one common issue seen with location data is incomplete or missing data fields. At Quadrant, we developed a metric known as “Data Completeness” (the percentage of each data attribute that contains verifiable data). This allows data buyers to quickly and easily assess the number of missing data points in each attribute.
HORIZONTAL ACCURACY
Another key metric we always consider is Horizontal Accuracy (HA) - lower Horizontal Accuracy indicates good GPS data. In fact, we tend to reject data sources with high HA. In our Data Quality Dashboard, this metric is visualised as a histogram. It’s worth noting that HA can vary based on a user’s environment and weather conditions. For example, in certain built-up areas of if there is bad weather, readings can be less accurate. In contrast, clear skies and open line-of-sight to satellites will likely result in better horizontal accuracy.
DAYS SEEN PER MONTH
Days seen per month is a metric that gets even more granular than DAU/MAU. It enables us to see the distribution of devices over a certain period of time, we start by evaluating the number of days over the course of the month.
HOURS SEEN PER DAY
The number of Hours Seen Per Day, like days seen per month, for most use cases is usually more valuable when the number is higher. This should be obvious because it means we are recording a more complete picture of a user’s daily activity in terms of where they are located on an hour-by-hour basis.
DEVICE ID
Common Issue: When unaltered, the case of the DeviceID will usually represent if the device is from iOS or Android, but some vendors will try to either switch upper for lower/lower for upper cases, or they will use both cases.
Remedy: Prior to working with any alphanumeric value, always use a consistent case. Convert and test a sample device ID prior to evaluation.
LATITUDE AND LONGITUDE
Common Issue: There are many reasons why a company could be incentivized to alter these figures. Let's say the buyer requires a certain # of decimal points, so to make it get counted they add digits. To pass unique data filters disingenuous data providers add digits (including a trailing zero) so that the event doesn’t get marked as duplicate.
When Bidstream data comes in or for ad SDKs who don’t have location data permissions in the app, they will get the same lat/long for dozens of events (as they are calling the OS level last known location). Therefore, to make it look like the person is moving, or that the event is unique in the stream, they alter the lat/long slightly to represent someone staying in one place.
Remedy: By rounding the lat/long to 4 or 5 digits you will eliminate most of the common manipulation cases. This common filter is often used as well to eliminate multiple data events when a phone is stationary.
TIMESTAMP
Remedy: Convert all timestamps to epoch, then compare the first 9 digits. By removing the extra digits, you will be rounding to the nearest 10 seconds. Most SDKs do not take signals in intervals closer than 10 seconds so by eliminating the seconds or millisecond you don’t sacrifice data depth. For navigation apps that could be under 10 seconds, the person is moving in a car so the lat/long will be different anyways even if the timestamp is the same.
To make the most of their investment, buyers must always assess the quality assurance process of their data providers. Ensuring the supply of the highest quality location data should be a priority for data providers and performing consistent quality checks on the data supply chain is a crucial step.
Quadrant is determined to bring trust and visibility to the data economy, and we have employed various techniques to our own data offerings to achieve these standards.
Our blockchain protocol – Quadrant Protocol, “stamps” data that we receive, allowing customers to trace and verify the origin of the data and its authenticity. This technology allows for mapping of the data and data sources and de-clutter the field of information, helping users to eliminate resellers and trace bad data back to the person or organization responsible.
We also use manual data visualisation to help spot instances of low-quality or fraudulent data and remove them before reaching data buyers. In addition to this, our data noise filtering technology plays a key part in our analysis in ensuring high-quality data for data buyers. We also employ overlap analysis techniques to efficiently eliminate duplicate data.
Our online suite of quality metrics provides you with access to an overview prior to running a full evaluation.